Tools of the trade
Now that we have uploaded our data to ChartedSails, added all the files and notes in our possession, it's time to learn what are the different types of measurements we can take, and how to do it effectively.
We will start by discussing the tools available in the interface to take measurements and then discuss interesting measurements.
The Instrument Panel
In the left part of the screen, you will find the Instruments panel. This panel displays all the data available for all the boats at a given point in time indicated at the top.
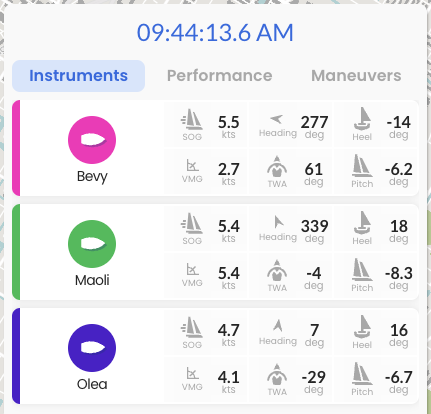
You can resize this panel to make it wider and show more information:

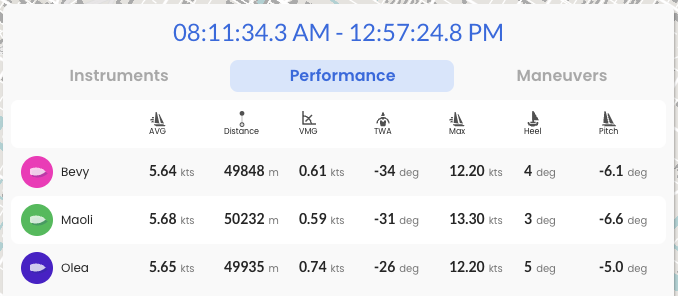
The Performance Panel
The Performance Panel is the second tab in the same window. Where the instruments always show data at one point in time, the performance panel shows aggregated data.
Aggregation is a data analysis term that simply means that we are grouping many points together and summarizing them into one or a few values. The simplest example of aggregation, and perhaps most often used in sailing is the Average. Another one that you are familiar with is the Maximum.
A key aspect of aggregation is understanding what data points have been summarized. ChartedSails always makes this clear by showing at the top of the panel the points that have been included.
By default, ChartedSails aggregates over the entire day so you can see what distance you sailed, what was the average speed, max speed, etc.
You can very easily zoom on a specific time period by clicking on the timeline and dragging the mouse. When you do this, the Performance panel updates to show you data for just the interval you selected. Notice also that the time at the top changes to show the selected interval.
ChartedSails can do even more complex aggregation for you. In the next chapters, we will discuss how to compare the performance of different boats in one race or one leg of a race, even when they started and finished at different times.
The graph
At the bottom of the screen ChartedSails represents the data visually. By default the Speed Over Ground is represented.
To see other variables, you must first select a specific boat and then select which variable to look at:
Boat tails
Another essential tool is the tail selector. It controls how much of the track is represented on the map and lets you visually represent the speed by coloring the track.
In Tail mode, ChartedSails will only show the last 10 minutes in a fading color that is unique to each boat.
In Full Tail mode, ChartedSails represents the entire track of the boat.
In Speed mode, ChartedSails represents the Speed Over Ground. The scale is specific to the current selection.
Quick Measurement
The last tool we will discuss is the quick measurement tool. This allows you to very easily take measurement over any straight line segment. It makes it trivial to compare angles and speeds of tacks or multiple boats.
Three Areas to Focus On
1. Practice Volume: Quantity Matters
To get results, you need time on the water. ChartedSails automatically tracks:
- Total sailing time
- Number of tacks executed
- Number of jibes completed
- Distance sailed
Action Step: Build a profile of what a regular training day looks like for you, then set a goal to increase your numbers by 10-15% next time.
2. Straight Line Speed: Understanding VMG
Velocity Made Good (VMG) is the speed component directly toward your destination, whether sailing upwind or downwind. It's your most important performance metric.
ChartedSails makes it easy to analyze your VMG performance:
Hover your mouse over the chart to see SOG (Speed Over Ground), VMG, and TWA (True Wind Angle) for each tack
Look for patterns in your data to answer these questions:
- When is your VMG the highest?
- What boat speed and angle produce your best VMG?
- Do you tend to pinch (sail too high) or foot (sail too low)?
- What heel angle gives you the best performance?
Action Step: Identify your optimal TWA for maximum VMG in different wind conditions and make note of it for future reference.
3. Maneuver Efficiency: Tacks and Gybes
Every tack or jibe costs you energy and speed. The key questions are:
- How much speed did you lose during the maneuver?
- How long did it take to regain your speed?
ChartedSails has a dedicated Maneuver Analysis tab in the instruments panel. It automatically detects all your tacks and gybes and shows you the VMG during each maneuver. At the bottom, you'll see the average VMG across all your maneuvers — a quick way to gauge your overall maneuver efficiency.
You can view maneuvers for one specific boat or all boats at once, and click through individual maneuvers to see how each one went. This makes it easy to find your best and worst tacks and understand what you did differently.
You can also use the Speed-colored track mode to visually spot speed loss and recovery during maneuvers on the map.
Action Step: Compare your fastest maneuvers with your slowest ones. What techniques are you using differently?
One design coaching techniques
For more inspiration, continue on to our interview of "Fuzz" (Grant Spanhake) on the blog. He goes into details on what he likes to focus on when coaching one-design groups.
Pro Tip
Create a "speed journal" where you record your optimal angles and speeds in different conditions. Over time, this becomes your personal polars for your boat.
Now that you understand the key performance indicators, you're ready to move on to analyzing your races to extract even more valuable insights.